
As a really ski fun, I wanted to take a look to what data we have about ski resorts and how we could label it. This a very small project, but also will give me an idea of how complex a project could be and what could be the most difficult steps.
I decided to use the web www.nevasport.com, which have a lot of users to understand what kind of information I could extract about ski resorts and their users. I wanted all this project had to be based on Python. I found an interesting Python module called BeautifulSoup, that together with webdriver allowed me to navigate through the site web pages and extract the information that I wanted. Of course, it would have been much easier if the site could provide APIs to be called and extract information, but that wasn´t the case. Maybe sites like this could start thinking about selling or making their data available for others.
Using those packages, I was able to extract the list of all users, the list of all the ski resorts in the system, how many ski resorts each user had visited and what are the rates for each user for the different resorts visited. This wasn´t a very easy task as I had to consider the format of each page and how the information was displayed in order to extract useful information.
Once the process to extract information was defined, all that info was dumped into flat files in my storage system. This was a time-consuming task as my computer had to browse the entire website. In fact, extracting all that information was the lengthier task in the process.
The next step in the process was to put some order to that data stored in flat files. As I wanted to run some queries against that data, I decided to use containers to bring up a mysql instance and fill a database with the data collected, so I could run some queries to understand better what information we had.
At that site, users can rate ski resorts based on different characteristics, like easy access, freeride areas, easy slopes, family ski, etc… I thought this could be quite interesting in order to classify ski resorts depending on those characteristics.
For example, we could find good resorts for beginners based on the ski resort access, how easy is to reach the beginners areas and if they have good slopes for beginners. With the extracted data, I used sklearn and KMeans to classify the ski resorts based on those characteristics.
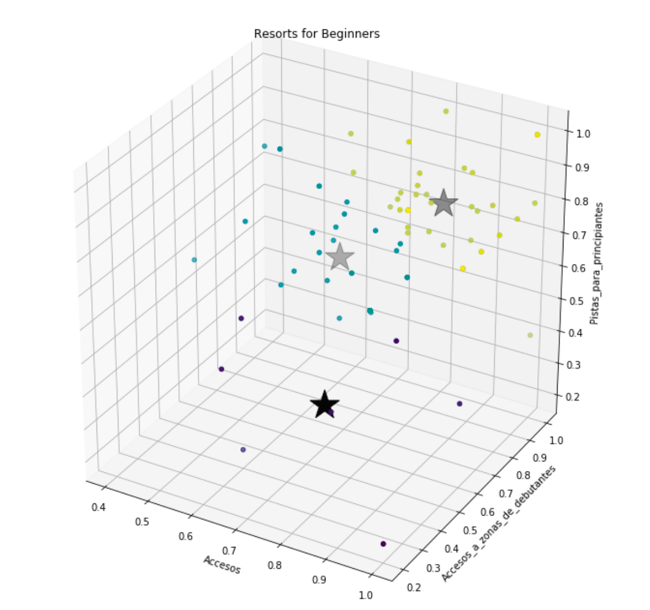
The big star represents the centroids for each of the 3 clusters we asked the algorithm to create.
As a note (and I know this will create a lot of controversial opinions), these are the top 5 ski resorts on the top cluster with the number of visits from nevasport users, and the average rating (from 0 to 1):
                          resort  num_visits       avg
0                   Cerro-Castor          57  1.000000
1               Teide-Ski-Resort         229  0.933333
2                     Courchevel         437  0.900000
3                      Candanchu        1589  0.896296
4           Vallnord-Pal-Arinsal        1027  0.888889
5                      La-Molina         879  0.868254
Top five in the middle:
              resort           num_visits       avg
0             Vallnord        1018            0.760000
1             Formigal        2163            0.749351
2             Masella         885             0.748148
3             Vallnord-Ordino-Arcalis        1001  0.746667
4             Val-Thorens     582             0.733333
And top five on the low one:
          resort  num_visits       avg
0        Soelden         172  0.666667
1         Tignes         708  0.666667
2         Ischgl         261  0.533333
3       Tavascan         122  0.466667
4  Vall-de-Nuria         253  0.400000
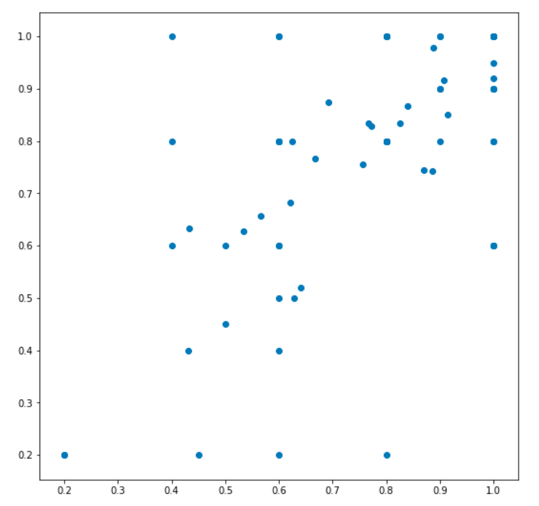
A more interesting classification for ski fans is the ski resorts that are good for experts. In order to do that I used two metrics, slopes for experts and freeride areas.
This is the initial data without being labeled:
When applying the KMeans algorithm to create three clusters, this is how it looks like with their centroids:
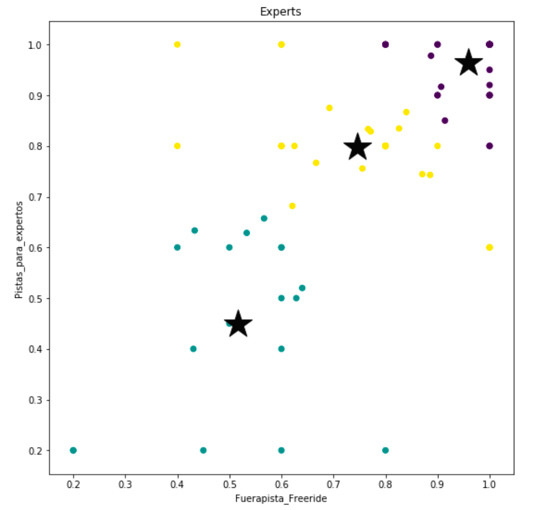
These are the ski resorts on the top:
                                 resort  num_visits       avg
0   Aspen-Snowmass-Highlands-Buttermilk          98  1.000000
1                           Val-Thorens         582  1.000000
2                           Val-d-Isere         555  1.000000
3                      Teide-Ski-Resort         229  1.000000
4                    Stubaier-Gletscher          95  1.000000
5                              Snowbird          34  1.000000
Ski resorts in the middle:
                  resort  num_visits       avg
0                 Cerler        1732  0.853333
1         Los-Penitentes          27  0.850000
2            Grandvalira        2130  0.830285
3    Fuentes-de-Invierno         304  0.814286
4                  Astun        1625  0.807516
And the ones on the low:
                resort  num_visits       avg
0           Javalambre         400  0.611905
1            Zillertal         104  0.600000
2            Port-Aine         592  0.580952
3      Sierra-de-Bejar         462  0.580000
4           San-Isidro         601  0.564286
The most interesting part of this project is to use Python libraries that make extracting and analyzing information very easy. Around 20 years ago, I spent several months programing algorithms to do things like this, while nowadays with a few lines of code I can run the KMedias algortithm:
# Number of clusters
kmeans = KMeans(n_clusters=3)

# Fitting the input data
kmeans = kmeans.fit(X)

# Getting the cluster labels
labels = kmeans.predict(X)

# Centroid values
C = kmeans.cluster_centers_
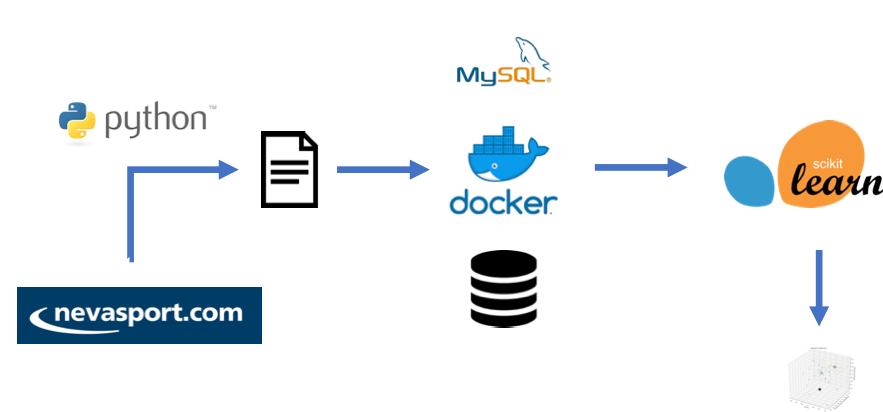
As a summary, this is the workflow to extract, classify and analyze the information:
Some lessons learnt is that extracting data can be a complex task. I just used one web site, but there are many more sites available in the world with useful data. Same thing happens with data sources for any company or business. Normalize that data can be a very time consuming as each source will represent data with different formats and metrics.
Another point is how to manage that data. This was a small project with a very small data footprint. But real enterprise project will require storing large amounts of data and making it accessible to all different users that will be running different projects with that same data. Here containers is a very interesting tool, but also you have to make sure the storage subsystem will be able to provide the speed needed and the flexibility to share that data across all users.
And now, let´s snow!!!!
Carlos.-